

Hey enthusiasts, recently I've started to learn AI ML from available free resources on the internet like free books pdf, LinkedIn groups, and FreeCodeCamp tutorials. I've worked on a few basic projects of AI ML (with tutorial blogs on the way), on a pleasant evening while having my favorite coffee, I got the idea to analyze the data of any application. But, how can I even get started with that? Does any company provide my data? By googling it, I learned that one of my favorite applications - Spotify does it. Here is the way I got my own Spotify data, you too!
How to get our data from Spotify?
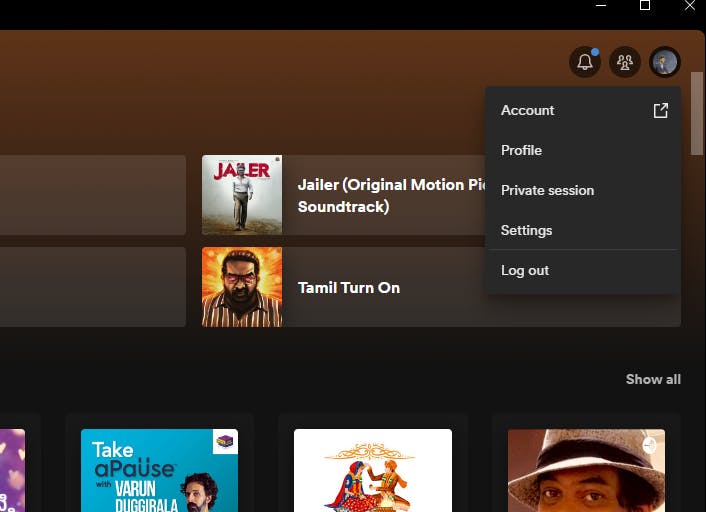
I hope you all have a Spotify account, please log in to it.
Then, go to the account section, and click on Account as shown in the image.
After clicking this, you will be redirected to the website of Spotify, which something looks like this.

Now, scroll down, select
Privacy Settingsand request your data from Spotify.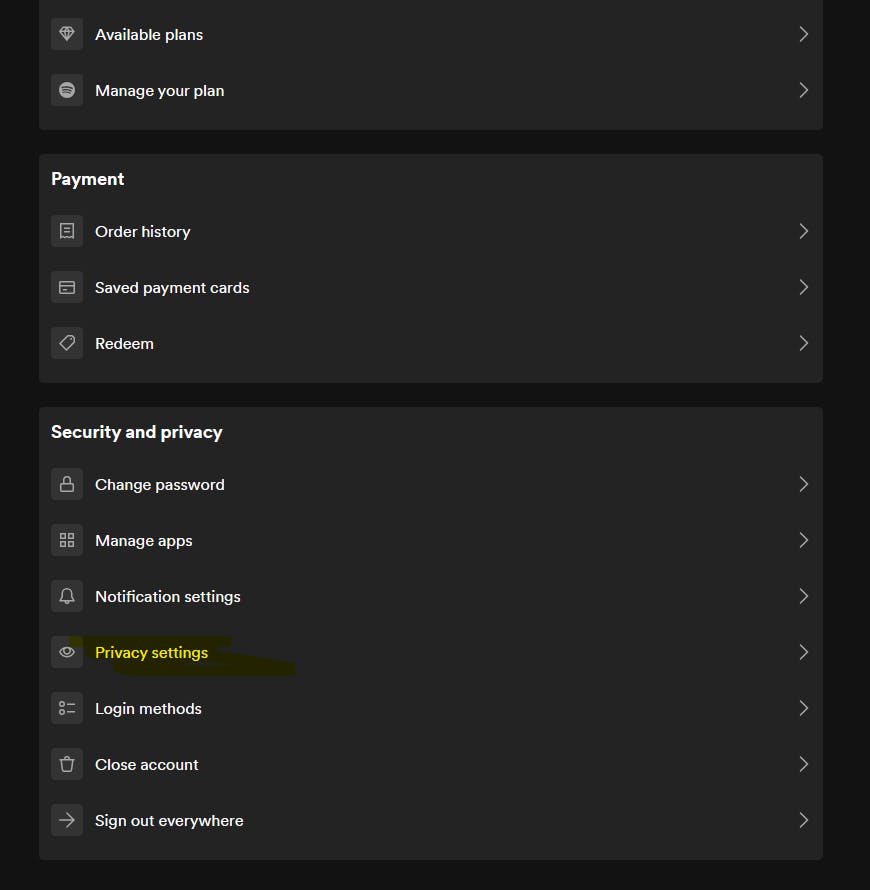
I recommend you select the Account data and access the data within in maximum of 5 days.

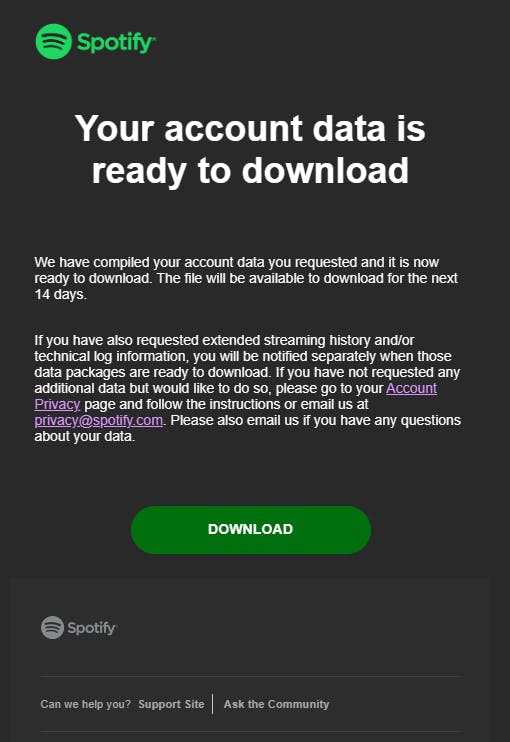
Once you request your data, it sends a confirmation mail. Kindly confirm it and you get your data once it gets gathered you can only able to download it within a time limit.
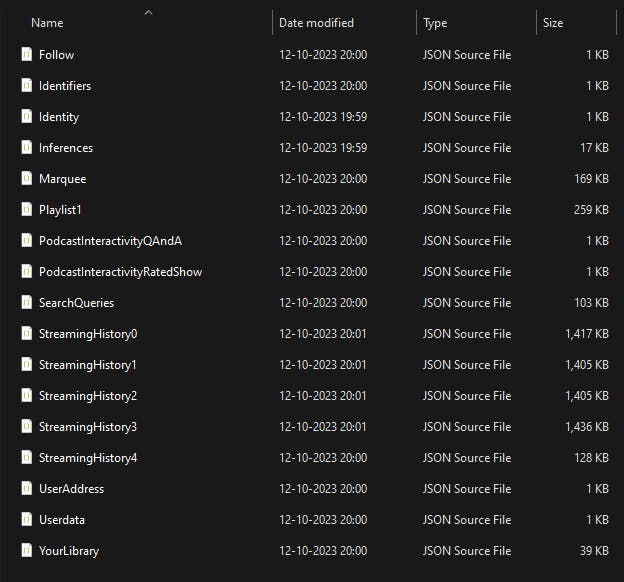
Once you download the zip file, extract the files into your preferred location of your files system, and it is in the format of JSON.

Once you download the zip file, extract the files into your preferred location of your files system, and it is in the format of JSON.
Let's Start Analysing it!
Congratulations! You've successfully gathered your own data from Spotify. What's next? Of course, it is to analyze it. But, it is in the JSON format, right? For me, I feel more comfortable in using CSV files for it. So, for it, I am using third-party websites that convert JSON to CSV files without disturbing the structure or content of the JSON (you can easily google it and use any of them, it doesn't make any big difference in them)
Wait, we are not going to analyze all those files. Only the files of StreamingHistory we use for it. Because, it contains the data of which song we've listened to, date, time, and artist name as well. I think that's enough for us to get to know our listening activity.
For analyzing the data, I am using the Anaconda Jupyter Notebook, I recommend you use the one you are comfortable with. Create a directory and open it on Jupyter Notebook> Create a new ipython file and import these libraries.

And then, we usually work on single datasets, but here we have multiple datasets, to make it one and use it we simply initialize an array of datasets and concatenate them all into a single. For that, the code something looks like
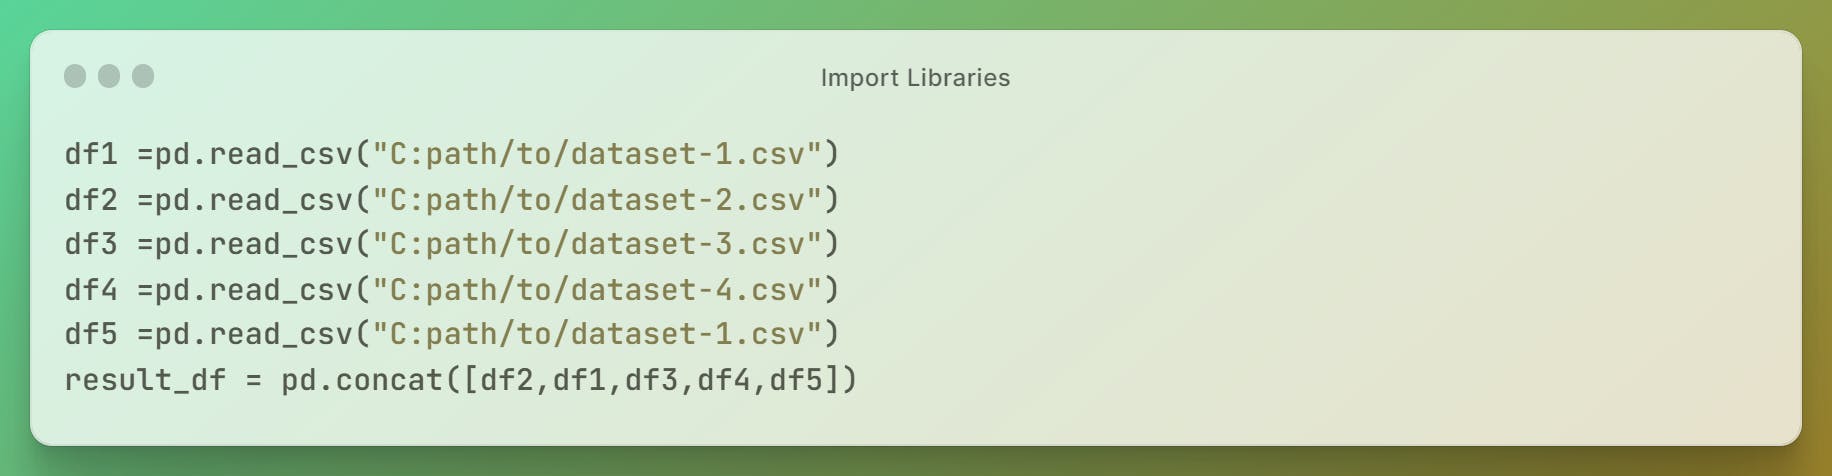
By doing this, we can concatenate all the multiple datasets into a single variable instead of using multiple variables of datasets. Let us start to analyze the data of it.
Performing Exploratory Data Analysis -
result_df.head()
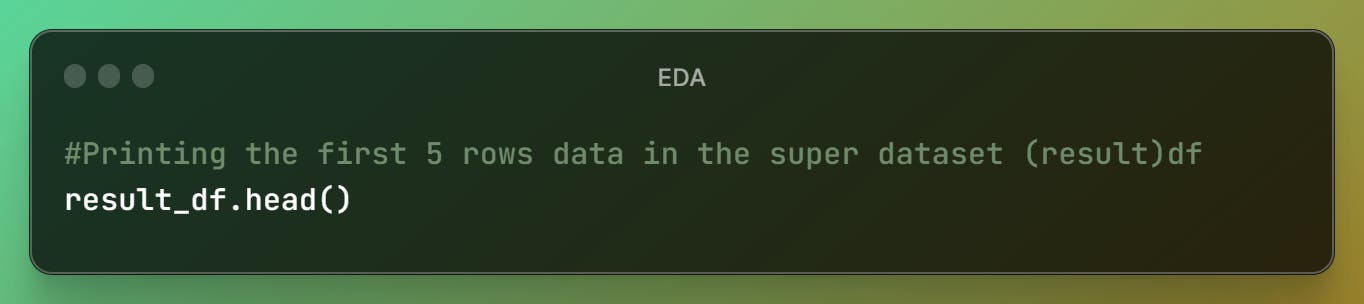
- This code prints the top five records in the dataset, to change the count just pass the number into the function as a parameter.
result_df.info()

This function helps to get the basic information about the data in the dataset.
Here, there are 40884 entries in the dataset, and in each individual column, there are the same amount of entries. It means no data is missing here!
result_df.size()
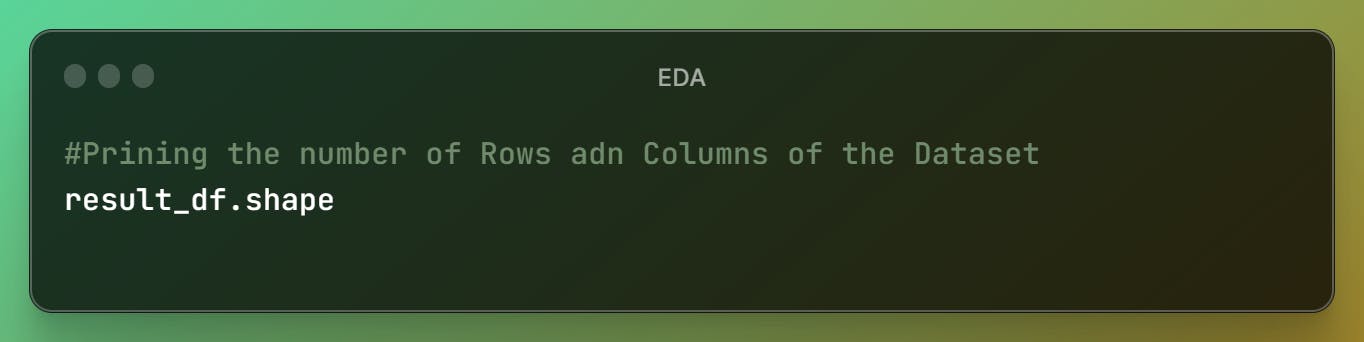
- Shape function is used to print the number of rows and columns of the dataset we are using.
result_df.column

- This function prints the column names of the dataset we are using, as you can see in the result.
result_df.describe()
- Describe method provides the statistical value of the dataset, like mean and other values as you see...
Let us stop the EDA by here, and start displaying the analytical values or graphs using Matplotlib and Seaborn libraries which are used to visualize the data.
Visualize Data -
I would like to know which artist I listen to most of the time on my Spotify. So, for this, I am choosing a Bar graph that shows the clear difference between artists and the time I listen to them.


- I can easily get to know that I frequently listen to
Anirudh Ravichanderthan other artists likeS.P Balasubhramanyam,Devi Sri Prasadand others. They are not even close toAnirudh.
- I can easily get to know that I frequently listen to
Now, to print the top tracks I've listened to Spotify, based on their count. For this, I am going with a Horizontal Bar Graph.
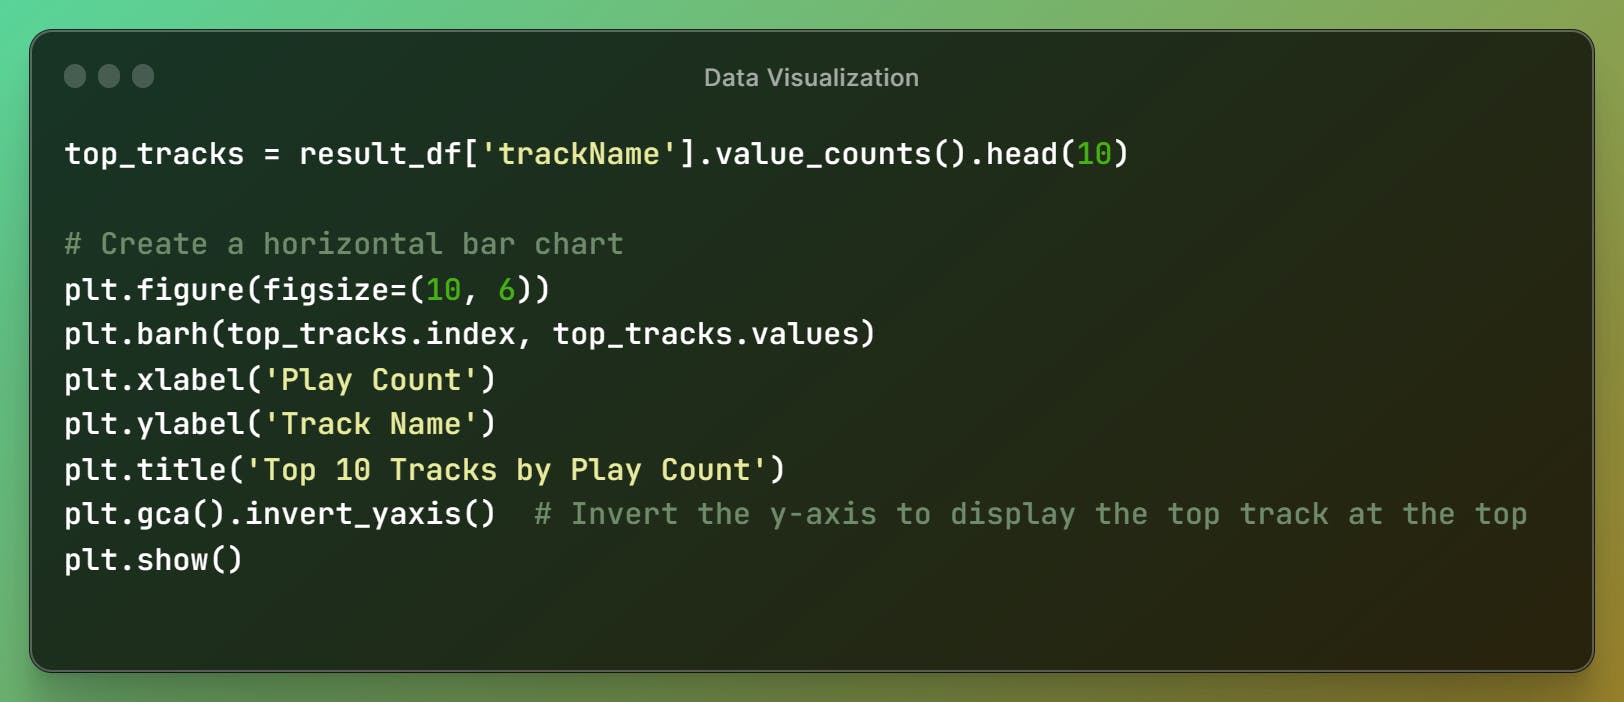

- As you can see, I've Listened to
Hanuman Chalisafor more than 200 play count, and next standsJD Intro BGMand others.
- As you can see, I've Listened to
I've now analyzed the part of the song, let us try to analyze the podcast listening activity on Spotify.
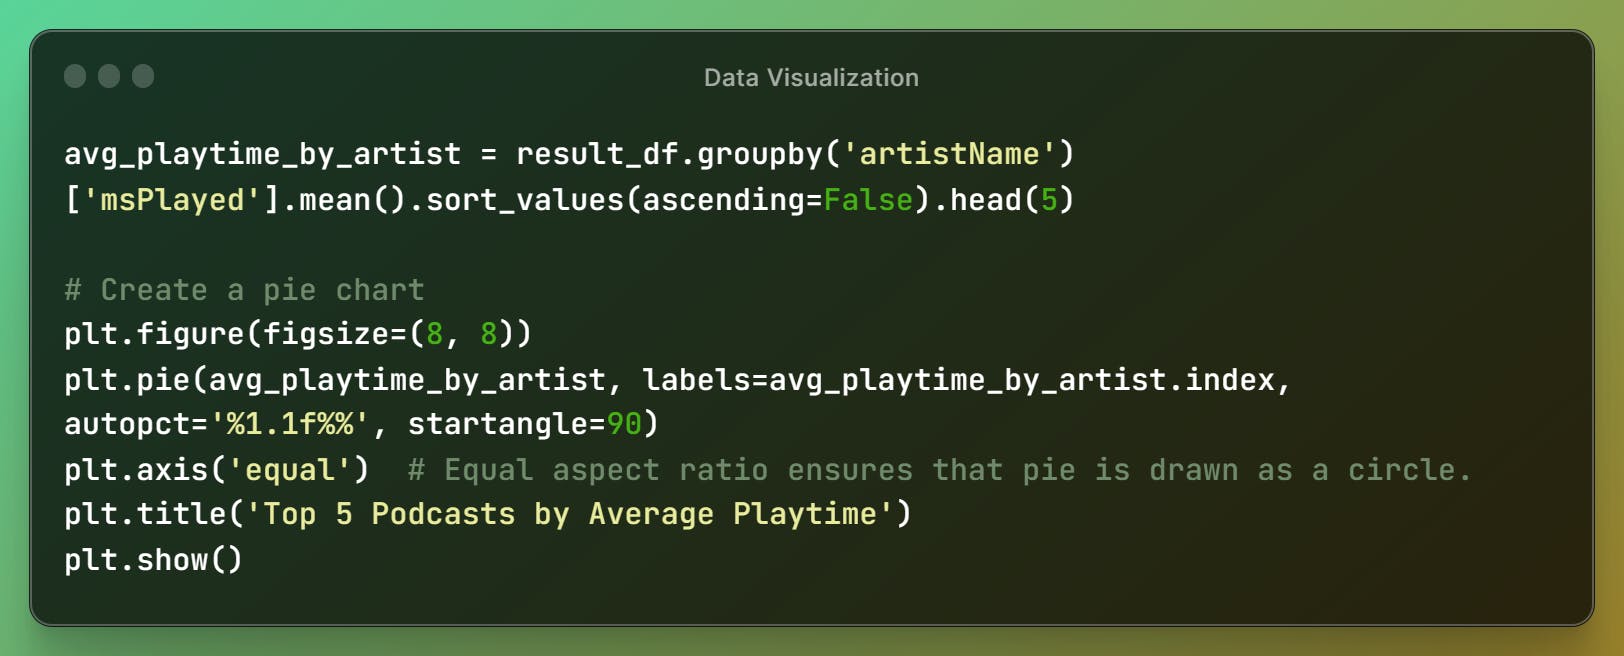
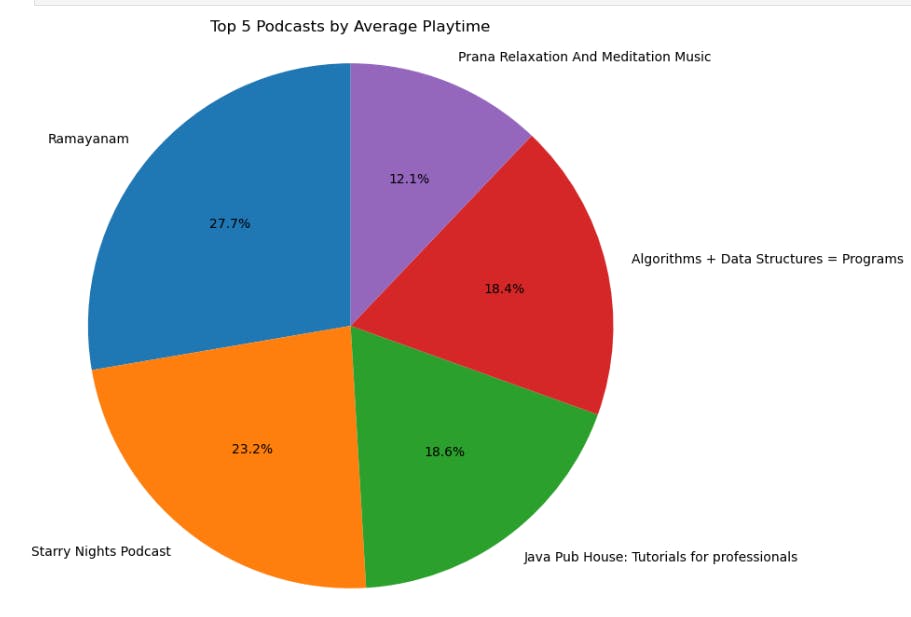
By this pie chart, I can easily display the top 5 podcasts I've consumed more on my Spotify activity.
I've listened to
Ramayanammore than others likeStarry Nights Podcast, Java Pub House,Algo + DSAandPrana Music- To show the listening playtime by graph for every month


- This clearly shows that I've consumed Spotify content more in Feb of the year.
- Now, comparing both terms Top Artist and Playtime over time for a better analysis of which artist I've listened to more in the year.

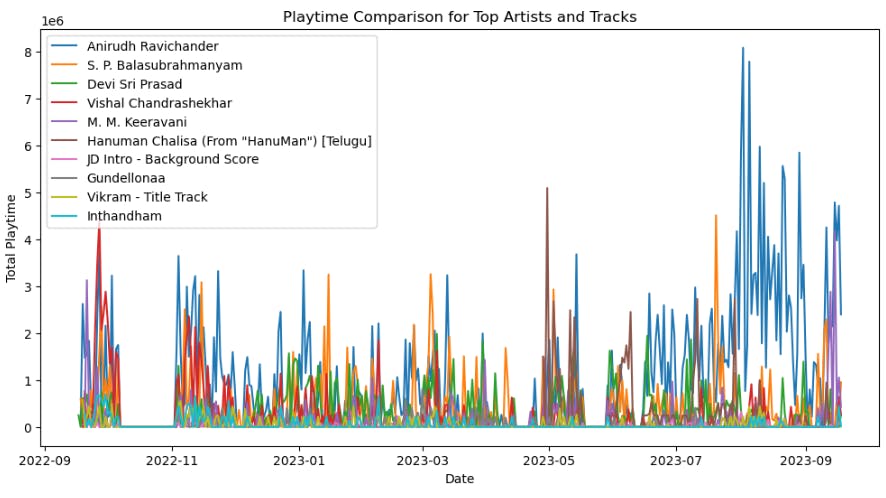
The average playtime for each artist is higher than the average playtime for each track. This is likely because I tend to listen to multiple songs from the same artist in a row, whereas they may listen to a single track from one artist and then move on to another artist.
The graph also shows that the playtime for top artists and tracks has been increasing over time. This is likely due to a number of factors, including the growing popularity of streaming music services, the increasing availability of new music, and the changing listening habits of consumers.
- Let us analyze the listening activity for each day of the week by taking an average for the whole dataset of listening.
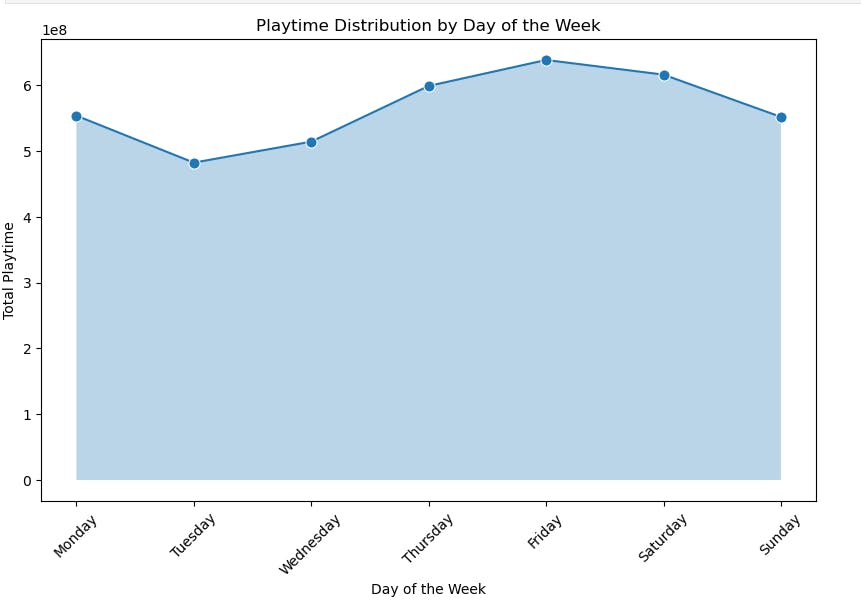
- It clearly defines that I've listened more on Friday than on other days in a week.
As my knowledge, I've just performed EDA analysis and Basic Data Visualization. I highlly recommend you to go through my GitHub repo to analyse it more deeper. It includes my listening activity datasets aswell, contributions are always accepted.